


 U.S. Gasoline Consumption by Year, Day & State (2026)
Explore U.S. gasoline consumption trends with yearly, monthly, daily, state, and global data — plus innovative research on “Gasoline Superusers.”

How much gasoline does the United States use? In 2025, U.S. finished motor gasoline product supplied totaled about 136.97 billion gallons (3.261 billion barrels), averaging approximately 375.3 million gallons per day or 8.93 million barrels per day, according to the EIA. That’s roughly the equivalent of completely filling up a Ford Explorer's gas tank over 7.5 billion times over the course of the year.
The United States remains by far the world’s largest gasoline consumer. The U.S. burns more than one-third of the world’s gasoline despite making up only about 4% of its population.
Where does all that fuel go? Nearly all gasoline burned in the U.S., about 91% of all U.S. gasoline consumption according to the EIA’s Annual Energy Outlook 2026 estimates, goes into light-duty vehicles — our cars, SUVs, and small trucks.
Gasoline use is highly concentrated among drivers. According to Coltura's analysis, a small fraction of U.S. drivers — the top 10% for consumption, known as “Gasoline Superusers ”— burn more gasoline than the bottom 70% of U.S. drivers combined. The global context makes this even more striking. Making up just 0.24% of the world’s population, U.S. Superusers burn roughly 10% of the world’s gasoline. That’s over 40 times the global per-person average.

Key Takeaways
Live data: the national annual, monthly, year-to-date, rolling 12-month, weekly demand, weekly production and U.S. regular-gasoline price figures below update from EIA data. Finalized monthly consumption currently updates through June 2026. Weekly figures are preliminary. Last editorial review: August 31, 2026.
About the measurement: EIA does not directly count every gallon pumped at every U.S. gas station. This article primarily uses finished motor gasoline product supplied, EIA’s standard supply-side proxy for U.S. gasoline consumption and demand. The monthly engine used here starts with EIA’s total-volume series and derives daily averages from each month’s total and number of calendar days.
Table Of Contents
-
- How Much Gas Does The U.S. Use Per Day?
- What Is U.S. Gasoline Demand Right Now?
- U.S. Gasoline Consumption By Month
- U.S. Gasoline Consumption By Year
- U.S. Gasoline Consumption By Decade
- U.S. Vs. World Gasoline Consumption
- U.S. Gasoline Consumption By State
- U.S. Gasoline Production
- Average Gas Spending Per Year
- Gasoline Consumption Per Person
- Pollution From Gasoline
- U.S. Gasoline Consumption Policies
How Much Gas Does The U.S. Use Per Day?
In 2025, U.S. finished motor gasoline product supplied averaged approximately 375.3 million gallons per day, equal to 8.93 million barrels per day. Total annual volume was about 136.97 billion gallons, a -0.63% change from the previous full year.
The latest finalized month, June 2026, averaged about 374.5 million gallons per day (8.92 million barrels/day). That monthly daily rate changed +2.71% from the previous month and -5.08% from the same month one year earlier.
How Many Gallons Of Gas Are Sold Or Pumped In The U.S. Each Day?
There is no single federal count of every retail gallon pumped each day. For national comparisons, EIA’s product-supplied measure is commonly used as the consumption proxy. On that basis, the latest finalized monthly rate is 374.5 million gallons per day in June 2026. Weekly product supplied gives a faster but more volatile estimate.
Sources: EIA monthly finished motor gasoline product supplied — total volume; EIA monthly daily-rate series.
What Is U.S. Gasoline Demand Right Now?
For Jan–June 2026, U.S. finished motor gasoline product supplied totaled approximately 66.41 billion gallons and averaged 366.9 million gallons/day (8.74 million barrels/day). Compared with the same months a year earlier, current-year gasoline volume changed by -1.59%.
The comparable Jan–June 2025 period totaled 67.48 billion gallons and averaged 372.8 million gallons/day.
Latest Weekly U.S. Gasoline Demand
For the week ending September 4, 2026, EIA’s preliminary finished-motor-gasoline product-supplied estimate was 359.1 million gallons/day (8.551 million barrels/day). That was -4.16% from the previous week and +0.51% from approximately one year earlier.
The latest four-week average was 369.7 million gallons/day (8.801 million barrels/day), a -2.16% change from the preceding four-week period. The four-week average is usually more useful for interpreting near-term demand than a single volatile week.
U.S. Gasoline Demand Chart — Latest 12 Months
During Jul 2025–Jun 2026, U.S. finished motor gasoline product supplied totaled approximately 135.90 billion gallons, averaging about 372.3 million gallons/day. The preceding 12-month period, Jul 2024–Jun 2025, totaled 137.34 billion gallons. The rolling-year change was -1.05%.
Latest 12 Months Vs. Previous 12 Months
Rolling 12-month totals reduce the seasonal distortion that can make partial-year comparisons harder to interpret.
Weekly estimates are preliminary and can be revised. Finalized monthly data remain the primary measure used throughout this article.
For more details, see the EIA’s Finished Motor Gasoline Product Supplied series, which provides monthly data back to 1945.

U.S. Gasoline Consumption By Month
Gasoline demand is seasonal. Winter months are often lower, while spring and summer travel can push monthly demand higher. In the latest finalized month, June 2026, U.S. finished motor gasoline product supplied totaled approximately 11.24 billion gallons (267.51 million barrels), an average of 374.5 million gallons/day.
Within the latest completed year, the lowest monthly daily rate occurred in January 2025 at about 354.6 million gallons/day. The highest occurred in June 2025 at about 394.6 million gallons/day. The low-to-high swing was approximately 40.0 million gallons/day, or +11.3%.
U.S. Gasoline Consumption By Month — Latest 12 Finalized Months
Average million gallons per day. This chart rolls forward automatically as EIA publishes a new finalized month.
Source: U.S. Energy Information Administration, Finished Motor Gasoline Product Supplied.
U.S. Gasoline Consumption By Year
Annual data provide the clearest long-term comparison because they smooth out seasonal driving patterns. In 2025, U.S. finished motor gasoline product supplied totaled 136.97 billion gallons, averaging 375.3 million gallons/day. That was a -0.63% change from 2024.
| Year | Total (B gallons) | Avg (M gal/day) | Avg (M bbl/day) | YoY change |
|---|---|---|---|---|
| 2025 | 136.97 | 375.3 | 8.93 | -0.63% |
| 2024 | 137.83 | 376.6 | 8.97 | +0.52% |
| 2023 | 137.13 | 375.7 | 8.94 | +1.53% |
| 2022 | 135.06 | 370.0 | 8.81 | -0.07% |
| 2021 | 135.14 | 370.3 | 8.82 | +9.22% |
Conversion note: 1 petroleum barrel = 42 gallons. Daily averages are calculated from annual total volume and the number of calendar days in each year.
U.S. Gasoline Consumption By Year — Last 10 Completed Years
Billion gallons of finished motor gasoline product supplied. The chart updates automatically when a new complete year becomes available.
Source: EIA Finished Motor Gasoline Product Supplied, monthly total-volume series. Complete years in the table and chart are summed from finalized monthly totals.

U.S. Gasoline Consumption By Decade
EIA’s finished-motor-gasoline series extends back to the 1940s. The long-term pattern is a rapid postwar rise, slower growth and periodic disruptions, followed by a plateau near historically high levels. The pandemic produced an unusually sharp drop in 2020, after which demand rebounded.
| Selected year | Finished motor gasoline (B gallons) |
|---|---|
| 1950 | 40.10 |
| 1960 | 61.01 |
| 1970 | 88.68 |
| 1980 | 101.13 |
| 1990 | 110.91 |
| 2000 | 130.23 |
| 2010 | 137.86 |
| 2020 | 123.73 |
- 1950s–1960s: gasoline use grew rapidly alongside vehicle ownership and highway expansion.
- 1970s–1980s: oil shocks and fuel-economy improvements interrupted the earlier pace of growth.
- 1990s–2000s: consumption climbed again before flattening around the Great Recession.
- 2010s: demand returned close to record levels.
- 2020s: the pandemic caused a sharp 2020 decline, followed by a rebound. In 2025, annual finished-motor-gasoline use changed -0.63% from the previous year.
Historical source: U.S. Energy Information Administration. Selected historical values are manually reviewed; the rolling 10-year chart above updates automatically.
U.S. Gasoline Consumption Compared To The Rest Of The World
The U.S. is the biggest gasoline user on the planet. International consumption datasets typically lag by a year or more; see the latest available EIA international estimates and Coltura’s summary framing in the Gasoline Superusers report.


Driving America’s gasoline use is a relatively small group of high-consuming drivers in the top 10% in terms of gasoline consumption (“Gasoline Superusers”).
Gasoline Superusers collectively consume about 35% of all gasoline used by U.S. private light-duty vehicles. On average, Coltura reports they spend about 10% of their household income — around $530 per month — on gasoline. Annually, Gasoline Superusers consume about 40 billion gallons out of the ~115 billion gallons used by all U.S. private light-duty vehicles, and their gasoline consumption totals more than that of the bottom 72% of drivers combined.

U.S. Gasoline Consumption By State
EIA’s 2024 State Energy Data System (SEDS) Table F15 shows that Texas and California used the most motor gasoline. The ten largest state totals were:
| Rank | State | 2024 motor gasoline (B gallons) |
|---|---|---|
| 1 | Texas | 14.75 |
| 2 | California | 13.14 |
| 3 | Florida | 9.46 |
| 4 | New York | 5.25 |
| 5 | North Carolina | 5.17 |
| 6 | Georgia | 4.92 |
| 7 | Ohio | 4.76 |
| 8 | Pennsylvania | 4.43 |
| 9 | Michigan | 4.39 |
| 10 | Illinois | 4.19 |
State spending rankings differ because gasoline prices also vary. EIA’s 2024 motor-gasoline expenditure estimates put California at about $58.07 billion, Texas at about $42.50 billion and Florida at about $29.18 billion.
California Gasoline Consumption By Year
California used approximately 13.14 billion gallons of motor gasoline in 2024, equivalent to an average of about 35.9 million gallons per day across the leap year. Texas averaged about 40.3 million gallons/day, and Florida about 25.9 million gallons/day.
State totals are useful, but they do not show how consumption is distributed across individual drivers. Comparing states on a per-person, per-household or per-vehicle basis also requires choosing and clearly stating a denominator; a total-volume ranking is not the same as a per-capita ranking.
Source: EIA SEDS Table F15: Motor gasoline consumption estimates, 2024.
Coltura’s research on rural drivers explores why high gasoline use and fuel costs can create particular burdens in communities where driving distances are long and transportation alternatives are limited.

How Much Gasoline Does The U.S. Produce?
Gasoline production is different from gasoline consumption. In 2025, U.S. refineries and blenders produced approximately 145.06 billion gallons of finished motor gasoline, averaging 397.4 million gallons/day (9.462 million barrels/day).
U.S. Gasoline Production Per Day
In 2025, the annual production total above worked out to 397.4 million gallons per day (9.462 million barrels/day). In 2024, production totaled about 147.87 billion gallons. Production therefore changed -1.90% year over year, a difference of approximately -2.82 billion gallons.
Annual production was +5.91% relative to U.S. finished motor gasoline product supplied in the same year, a difference of about 8.09 billion gallons. Production and domestic product supplied are not identical because imports, exports, inventory changes and other supply adjustments affect the balance.
U.S. Gasoline Production Vs. Consumption
Latest Weekly U.S. Gasoline Production
For the week ending September 4, 2026, adjusted U.S. finished motor gasoline production was approximately 390.9 million gallons/day (9.308 million barrels/day). That was -5.45% from the prior week and -2.91% from approximately a year earlier.
The latest four-week production average was 405.7 million gallons/day (9.659 million barrels/day), a -0.20% change from the preceding four-week period.
U.S. Gasoline Consumption Map
Interested in learning more about gasoline consumption in the U.S.? Use Coltura’s interactive gasoline consumption map showing demographic insights and vehicle data from the state level down to the census block group level. This more granular view can reveal high-gasoline-use communities that national and state averages obscure.

Current U.S. Gas Price & Gasoline Price Volatility
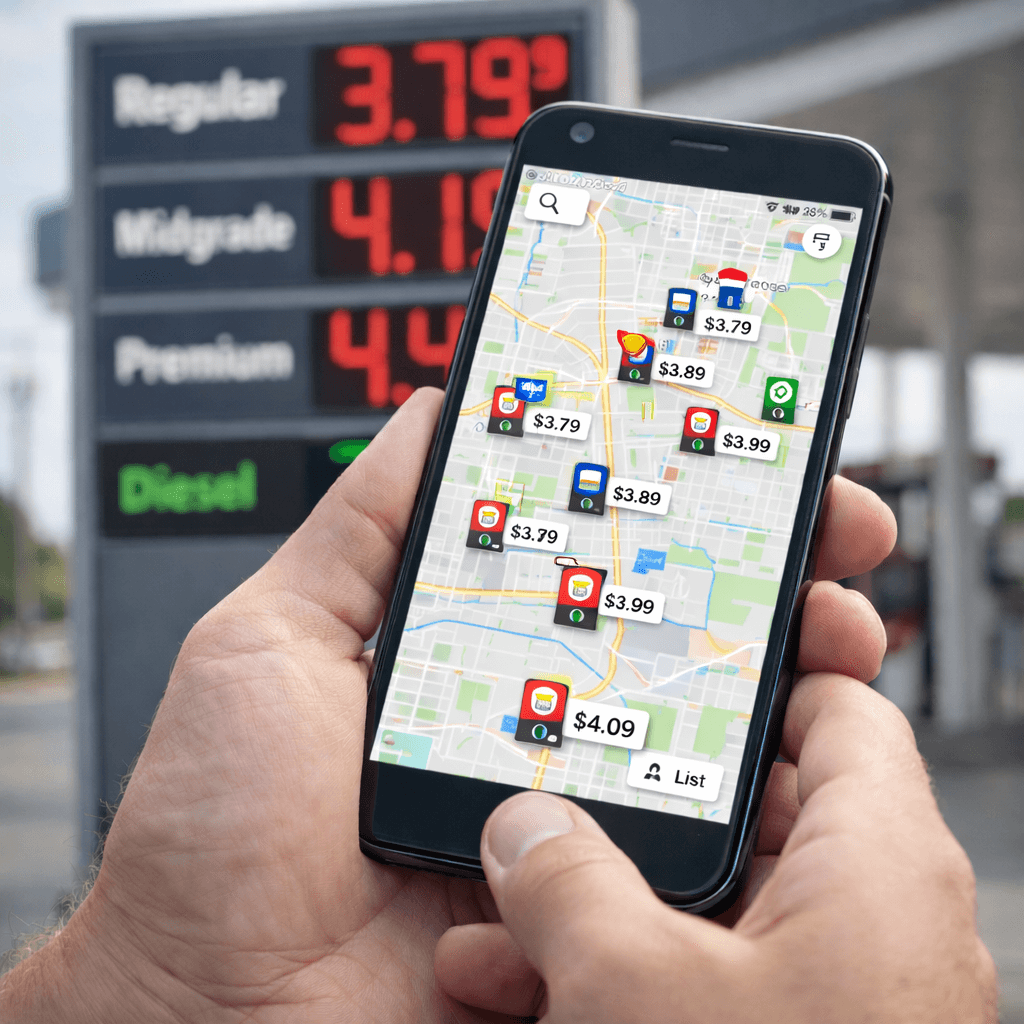
EIA’s latest U.S. average retail price for regular gasoline is $4.157 per gallon as of September 7, 2026. That is +2.11% from the previous week and +30.23% from about a year earlier.
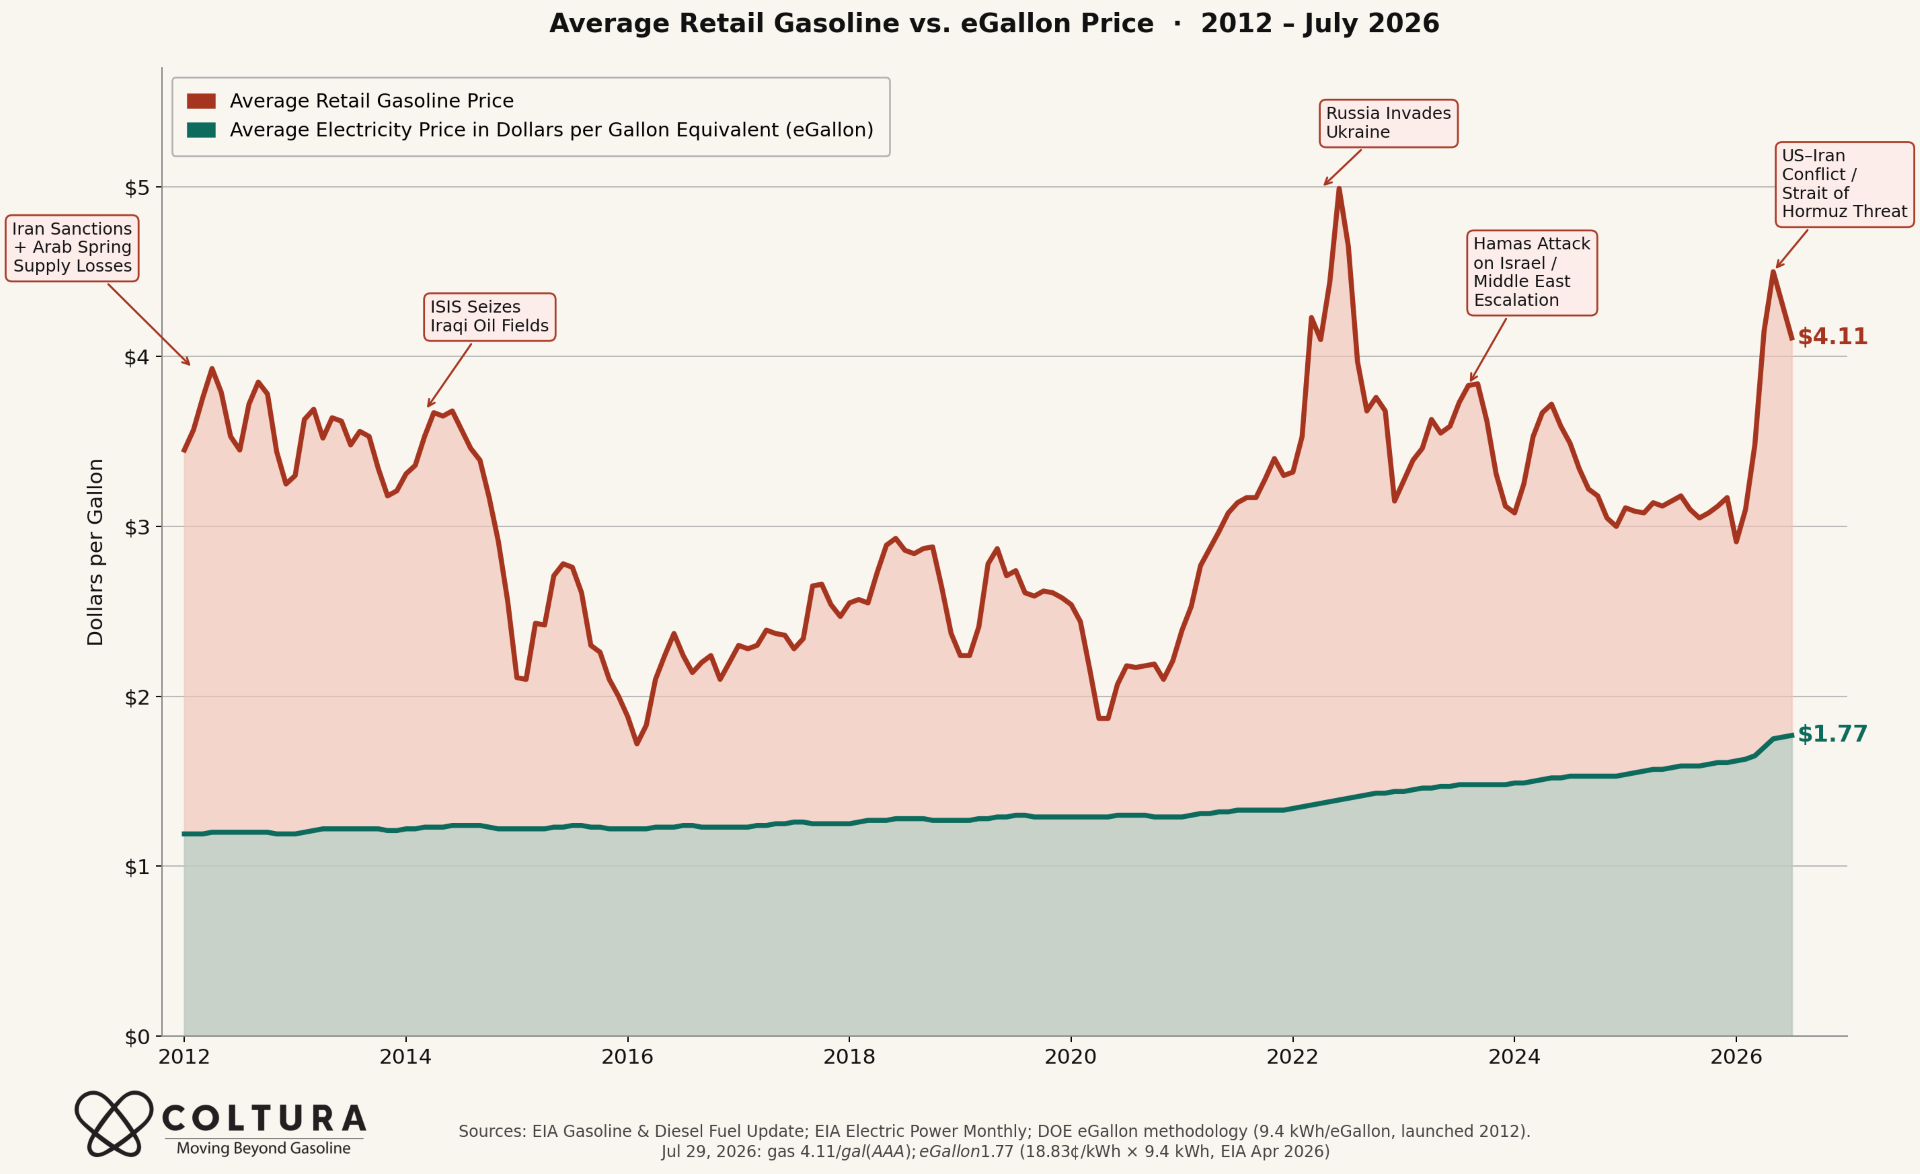
Average U.S. Gasoline Prices Have Been Far More Volatile Than eGallon Electricity Costs
Americans use enormous amounts of gasoline, and that leaves households exposed whenever oil markets swing. This Coltura chart compares monthly average U.S. retail gasoline prices with an electricity eGallon price estimate. It helps show why reducing gasoline consumption matters so much: electricity has been far less volatile over time.
Interested in a more updated and interactive version of the above chart? Check out Coltura's EV Cost Savings Index
Pollution From U.S. Gasoline Consumption
EIA’s preliminary 2025 energy-related emissions data show that transportation-sector motor gasoline produced approximately 1,037 million metric tons of CO2, while distillate fuel oil produced about 452 million metric tons. Combined, that was roughly 1.49 billion metric tons of CO2.
Total U.S. energy-related CO2 emissions were approximately 4,904 million metric tons in 2025, so motor gasoline plus distillate fuel oil were equivalent to about 30.4% of the national energy-related CO2 total. These 2025 figures are preliminary and can be revised.
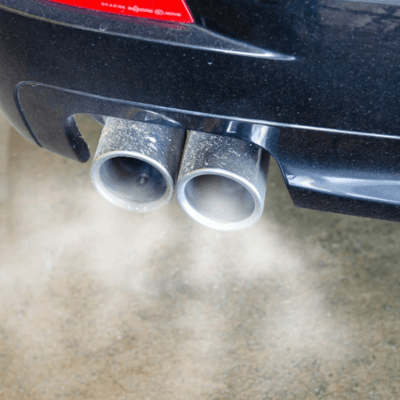
The environmental impacts of gasoline are not limited to tailpipe carbon dioxide. Pollution and other impacts occur across the petroleum life cycle, including extraction, transport, refining, storage and combustion. Learn more in the gasoline facts article.
Sources: EIA U.S. Energy-Related Carbon Dioxide Emissions; EIA Monthly Energy Review, Tables 11.1–11.6.


How Much Does The Average American Spend On Gas Per Year?
According to the latest annual U.S. Bureau of Labor Statistics Consumer Expenditure data currently available, the average U.S. consumer unit spent $2,411 on gasoline in 2024. That is about $201 per month or $6.61 per day when averaged across the year. Average gasoline spending was $2,805 in 2022 and $2,449 in 2023.
A BLS consumer unit is a household-like spending unit, not an individual American. Actual gasoline costs vary greatly with miles driven, vehicle fuel economy, local prices, household vehicle ownership and access to alternatives.
For high-consuming drivers, the burden can be much larger. Coltura’s 2024 Gasoline Superusers 3.0 analysis estimates average gasoline spending of about $530 per month among Gasoline Superusers in the analysis, equivalent to roughly 10.2% of household income.
Source: U.S. Bureau of Labor Statistics, Consumer Expenditures — 2024.
U.S. Gasoline Consumption Per Person
Using EIA’s 2025 finished-motor-gasoline total and the Census Bureau’s July 1, 2025 population estimate produces a simple national equivalent of approximately 399 gallons per U.S. resident per year, or about 33 gallons per month and 1.1 gallons per day.
This is not the amount used by a typical driver. It divides national finished-motor-gasoline product supplied by the entire U.S. population, including children and non-drivers, and the national total also includes gasoline uses beyond private household driving. It is best treated as a population-wide statistical ratio.
Sources: EIA, Use of gasoline; U.S. Census Bureau population estimates.
Curious how much you could save on fuel and maintenance switching to an EV? Get a quick estimate of your savings below!
*Disclaimer: This tool is only intended to provide an estimate of potential savings. Actual results will vary. Learn more about the calculation and the Electric vs Gas Calculator here.
Granular Data To Understand U.S. Gasoline Consumption
Coltura’s 2024 Cracking the Gasoline Code Report presents a detailed look at how gasoline consumption is distributed across drivers. It highlights trends that underscore the need to improve electric vehicle (EV) policies to be more efficient, effective, and fair.
The report argues that gasoline consumption isn’t decreasing quickly enough to meet climate goals — and that better, more granular data can help design smarter policies that prioritize the families and communities who would benefit most from cleaner transportation options.

What's Actually in a Barrel of Oil?
The Barrel Breakdown:

Here's what US refineries produce from every barrel of crude oil, according to the US Energy Information Administration (EIA):
- Gasoline — 45%. The single largest product from every barrel. Nearly half.
- Diesel — 25%. Primarily used by trucks, buses, and freight.
- Jet fuel — 9%. Aviation.
- Everything else — 21%. This is where plastics, chemicals, petrochemical feedstocks, heating oil, and all the other products people cite actually live.
Nearly 80% of every barrel of crude oil goes straight to transportation fuels.
Barrel breakdown reflects typical US refinery yields.
The Problem With Conventional Gasoline Data
Until the release of Gasoline Superusers 3.0, detailed “who uses how much gasoline” data at a highly granular level has not been widely available to guide policy design.
Instead, policymakers have often relied on broad state and national aggregate supply measures (like barrels of gasoline supplied), which can obscure large differences in gasoline consumption across drivers and communities.
These aggregated numbers can also contribute to the common (and sometimes faulty) assumption that every EV displaces an “average” amount of gasoline.
Conclusion: U.S. Gasoline Consumption Policies
Reducing gasoline use can lower household fuel costs, oil dependence, climate pollution and local air pollution. Coltura’s research emphasizes measuring gasoline displaced rather than assuming that every vehicle replacement produces the same gasoline reduction.
Potential approaches include accelerating access to electric vehicles, targeting high-gasoline-use vehicles for replacement, improving fuel economy, expanding clean transportation choices and using more detailed consumption data to direct programs where they can save the most fuel.
The goal of more granular data is not to ignore national totals; it is to add another layer of information. National EIA data show the scale and direction of gasoline demand, while vehicle- and community-level data can help identify where interventions could have the largest effect.
Learn more about Gasoline Superusers or compare gasoline and EV fueling costs.

Join Us
Switching gas cars to EVs offers hidden health benefits by reducing harmful emissions. That can mean fewer risks of asthma, heart and lung diseases, and other vehicle-emissions-related health problems — especially for families living near busy roads.
Imagine cleaner air for your children to breathe, a quieter neighborhood, and fewer trips to the mechanic. EVs aren’t just about saving money — they’re about creating a better future.
Help Build a Healthier Tomorrow
Join thousands of others making the switch to cleaner transportation! Sign up for our nonprofit’s Beyond Gasoline newsletter to stay up to date on the growing movement.

U.S. Gasoline Consumption FAQ
What Is U.S. Gasoline Consumption By Year?
The latest completed year is 2025, when U.S. finished motor gasoline product supplied totaled approximately 136.97 billion gallons. The dynamic five-year table and 10-year chart above provide recent annual comparisons.
Is There A U.S. Gasoline Consumption By Year Graph?
Yes. The rolling 10-year chart above shows finished motor gasoline in billion gallons for the latest ten completed years and updates automatically when another complete year becomes available.
How Much Gasoline Does The U.S. Use Per Day?
In 2025, U.S. finished motor gasoline product supplied averaged about 375.3 million gallons/day (8.93 million barrels/day). The latest finalized monthly rate is 374.5 million gallons/day in June 2026.
How Many Gallons Of Gas Are Sold In The U.S. Each Day?
EIA does not directly count every retail gallon sold or pumped. Its finished-motor-gasoline product-supplied series is commonly used as the national consumption proxy. The latest finalized monthly rate is 374.5 million gallons/day.
What Is U.S. Gasoline Demand Right Now?
The latest finalized month is June 2026, at 374.5 million gallons/day. EIA’s latest preliminary weekly estimate is 359.1 million gallons/day for the week ending September 4, 2026, with a four-week average of 369.7 million gallons/day.
How Much Gasoline Did The U.S. Use In The Latest Full Year?
In 2025, finished motor gasoline product supplied totaled approximately 136.97 billion gallons (3.261 billion barrels).
What Is The All-Time Record For U.S. Gasoline Consumption?
For annual volume, the record in EIA’s finished-motor-gasoline series is 2016, at approximately 143.22 billion gallons. The highest annual average daily rate occurred in 2018, at about 9.329 million barrels/day or 391.8 million gallons/day.
How Much Gasoline Does The Average American Use Per Month Or Year?
A simple population-wide calculation using 2025 finished-motor-gasoline volume is approximately 399 gallons per U.S. resident per year, or about 33 gallons per month. This is not the average for a licensed driver; it is national product supplied divided by the entire U.S. population.
What Is Average Gasoline Consumption Per Household Or Driver?
There is not a single current EIA statistic that can be substituted for the population-wide ratio and called an “average household” or “average driver” gasoline figure. Household and driver estimates depend on the denominator, vehicle ownership, miles traveled and vehicle efficiency. The 399-gallon-per-resident figure above should therefore not be relabeled as household or driver consumption.
How Much Does The Average American Spend On Gas Per Year?
The latest annual BLS Consumer Expenditure data currently available show average gasoline spending of $2,411 per consumer unit in 2024, about $201 per month. A consumer unit is a household-like spending unit, not an individual person.
How Much Gasoline Does The U.S. Produce?
In 2025, U.S. refineries and blenders produced approximately 145.06 billion gallons of finished motor gasoline, averaging 397.4 million gallons/day. The latest preliminary weekly production rate is 390.9 million gallons/day.
What Is The Difference Between Gasoline Production And Consumption?
Production measures finished motor gasoline produced by U.S. refiners and blenders. Product supplied is EIA’s proxy for domestic consumption. They differ because of imports, exports, inventory changes and other supply adjustments.
Does The U.S. Gasoline Total Include Aviation Gasoline?
The main live figures on this page cover finished motor gasoline. EIA reports that total U.S. gasoline consumption in 2025 was about 136.72 billion gallons, consisting of about 136.53 billion gallons of finished motor gasoline plus roughly 0.19 billion gallons of finished aviation gasoline.
Which State Uses The Most Gasoline?
In EIA’s 2024 SEDS data, Texas had the largest motor-gasoline total at about 14.75 billion gallons, followed by California at 13.14 billion and Florida at 9.46 billion.
California Gasoline Consumption By Year
California used approximately 13.14 billion gallons of motor gasoline in 2024, equivalent to about 35.9 million gallons/day averaged across the leap year.
How Much U.S. Gasoline Is Used By Cars, SUVs And Light Trucks?
EIA’s Annual Energy Outlook 2026 estimate indicates that light-duty vehicles—cars, SUVs and small trucks—account for about 91% of all U.S. gasoline consumption.
What Is Gasoline Used For Besides Cars?
Light-duty vehicles dominate U.S. gasoline consumption, but gasoline is also used in motorcycles, recreational vehicles and boats, construction and landscaping equipment, farming and forestry equipment, and portable or emergency generators. Aviation gasoline is reported separately from finished motor gasoline in the main EIA totals used on this page.
Does The U.S. Use More Gasoline Or Diesel?
Gasoline is the larger transportation fuel. On an energy-content basis, EIA reports that gasoline excluding fuel ethanol accounted for about 52% of U.S. transportation-sector energy use in 2025, compared with about 22% for distillate fuels, which are mostly diesel.
How Many Days Of Gasoline Does The U.S. Have?
There is no single fixed “days of gasoline” number. Commercial gasoline inventories rise and fall every week, and EIA publishes those stock levels in its Weekly Petroleum Status Report. The Strategic Petroleum Reserve is primarily a crude-oil reserve, not a national stockpile of finished gasoline, so it should not be treated as a direct count of days of gasoline supply.
How Often Does The Average Person Fill Up With Gas?
There is no authoritative national EIA statistic for how often the “average person” refuels. As an aggregate scale comparison, the latest finalized monthly gasoline-use rate is equivalent to about 24,967,880 15-gallon fill-ups per day nationwide, and 2025 annual consumption is equivalent to roughly 9.1 billion 15-gallon fill-ups.